Nora Geiszl
Published: Jan 2023
Department of International Development
London School of Economics and Political Science
Houghton Street Tel: +44 (020) 7955 7425/6252
London Fax: +44 (020) 7955-6844
WC2A 2AE UK Email: [email protected]
Website: http://www.lse.ac.uk/internationalDevelopment/home.aspx
Abstract
This dissertation investigates how the 2008 Free Secondary Education (FSE) policy in Kenya impacted women’s educational attainment. I use the Kenyan Demographic and Health Survey between 1993-2014 and employ a difference-in-differences strategy exploiting exogenous variation from age cohort exposure to FSE. I find that FSE significantly increased women’s likelihood of attendance, while it remains ambiguous whether it increased the likelihood of completion and years of education. FSE was less effective at improving education for poor compared to rich women and there were significant regional differences in impact. The findings have important implications for designing effective future FSE policies in Kenya.
TABLE OF CONTENTS
Abstract
LIST OF ABBREVIATION
LIST OF TABLES AND FIGURES
List of Tables List of Figures
1. Introduction
2. Background & Policy Context
2.1 Women’s Education in Kenya
2.2 The FSE Policy
2.3 Problem Statement & Relevance
3. Literature Review
3.1 Conceptual Framework
3.2 Empirical Literature
4. Research Questions
5. Data
5.1 Dataset
5.2 Outcome Variables
5.3 Control Variables
6. Methodology
6.1 Difference-in-Differences Identification Strategy 6.2 Estimating Equation
6.3 Key Identification Assumptions
7. Results
7.1 Full Sample Results
7.2 Wealth Differences in Impact
7.3 Regional Differences in Impact
8. Robustness Check
9. Discussion
9.1 Mechanisms Explaining the Results
9.2 Limitations
10. Conclusion
10.1 Conclusions
10.2 Further Research
10.3 Policy Implications
Bibliography
Appendices
Appendix I: Data & Variables
Appendix II: Patterns in Outcome Variables Underlying the Difference-in-differences Strategy
Appendix III: Illustrating the Difference-in-differences Estimator
Appendix IV: Balance Tests
Appendix V: Regression Results
Appendix VI: Robustness Checks
Appendix VII: Mechanisms Explaining the Results
Appendix VIII: Further Limitations
LIST OF ABBREVIATION
DHS Demographic and Health Survey
DID Difference-in-difference
FE Fixed Effects
FPE Free Primary Education
FSE Free Secondary Education
JICA Japan International Cooperation Agency
KDHS Kenyan Demographic and Health Survey
Ksh Kenyan Shilling
MoE Ministry of Education
MoEST Ministry of Education, Science and Technology
OLS Ordinary Least Squares
RCT Randomised Control Trial
RDD Regression Discontinuity Design
SSA Sub-Saharan Africa
VDS Vision 2030 Delivery Secretariat
WB World Bank
LIST OF TABLES AND FIGURES
List of Tables
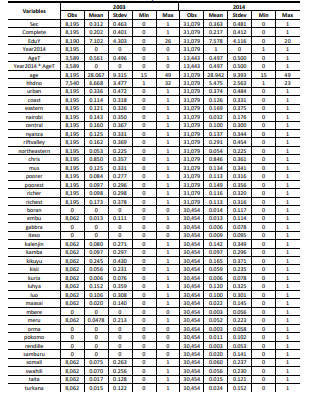
Table 1 – Summary statistics of data used in main analysis for 2003 and 2014, generated by author
Table 2 – Difference-in-Differences Estimates of the Impact of Free Secondary Education on Se.dary
School Attendance, Completion and Years of Education.
Table 3 – Wealth Difference-in-Differences Estimates of the Impact of Free Secondary Education Policy
on Secondary School Attendance and Years of Education.
Table 4 – Regional Difference-in-Differences Estimates of the Impact of Free Secondary Education on
Secondary School Attendance, Completion and Years of Education for eight regions of Kenya.
Table 5 – Placebo Difference-in-Differences Estimates of the Impact of Free Secondary Education Policy
on Secondary School Attendance and Years of Education.
Table A1 – Summary statistics of variables for 1993, 1998 and 2008.
Table A2 – Summary of all variables. Includes variable names and categories, type and description.
Table A3 – Illustrating the difference-in-differences estimator.
Table A4 – Balance test showing the difference in means of key observable characteristics between
women of treatment and control age groups between 1993-2014.
Table A5 –Difference-in-Differences Estimates of the Impact of Free Secondary Education on Secondary
School Attendance, Completion and Years of Education.
Table A6 – Wealth Difference-in-Differences Estimates of the Impact of Free Secondary Education Policy
on Secondary School Attendance.
Table A7 – Combined Wealth Difference-in-Differences Estimates of the Impact of Free Secondary
Education Policy on Secondary School Attendance and Years of Education.
Table A 8 – Wealth Difference-in-Differences Estimates of the Impact of Free Secondary Education Policy
on Secondary School Completion.
Table A 9 – Wealth Difference-in-Differences Estimates of the Impact of Free Secondary Education Policy on Years of Education.
Table A10 – Regional Difference-in-Differences Estimates of the Impact of Free Secondary Education
Policy on Secondary School Attendance.
Table A11 – Regional Difference-in-Differences Estimates of the Impact of Free Secondary Education
Policy on Secondary School Completion.
Table A 12 – Regional Difference-in-Differences Estimates of the Impact of Free Secondary Education
Policy on Years of Education.
Table A13 – Placebo Difference-in-Differences Estimates of the Impact of Free Secondary Education
Policy on Secondary School Attendance, Completion and Years of Education.
Table A14 – Regional differences in FSE impact, initial secondary school attendance and poverty rates in
2003.
List of Figures
Figure 1 – Secondary enrolment trends over time in Kenya.
Figure 2 – Map of Kenya
Figure 3 – Theory of Change for Women Empowerment
Figure 4 – Parallel pre-trends in educational outcomes for treatment and control groups between 1993-
2014.
Figure 5 – T-tests testing a statistically significant difference in the mean proportion currently employed
(Panel A) and married (Panel B) between treated and control women between 1993-2014.
Figure 6 – Graph of interaction coefficients of Placebo Difference-in-Differences Estimates of the Impact
of Free Secondary Education Policy over time.
Figure 7 – Correlation between regional differences in FSE impact on attendance, initial proportion of
women having attended secondary school or higher in 2003 and proportion of poorer or poorest
women in 2003.
1. Introduction
Empowering women through education in low-income countries is a prominent topic area in development research and practice. Women’s education is a fundamental human right that has intrinsic value to individual freedom (Sen, 1985), has great potential to improve long-term life outcomes for women and children and is key to promoting socio-economic development (Jejeebhoy, 1995). However, low educational attainment, particularly secondary schooling, has been a major hurdle to development in Sub-Saharan Africa (SSA), especially Kenya. Less than half of primary-educated children transitioned to secondary school in the mid-2000s in the country (Ndiku & Muhavi, 2013). Drop-out rates have been particularly high for low-income women and in less developed regions(MoEST, 2015b). The education system continues to suffer from limited resources, lack of funding and poor-quality teaching. Improving education has been at the forefront of the Kenyan government’s agenda. Free Secondary Education (FSE) was introduced in 2008, which covered tuition fees to allow more children, especially from poor households, to attend and complete high school. However, its impact has been ambiguous, as parents continued to pay for non-fee expenses such as lunches and uniforms, and implementation suffered from inefficiencies, lack of funds and limited considerations for gender and socio-economic inequalities (Ndiku & Muhavi, 2013).
This dissertation investigates how the 2008 FSE policy impacted women’s educational attainment, more specifically, secondary school attendance, completion and years of education. It empirically tests the predictions of Becker’s (1962) theory of demand for schooling, that reducing monetary costs increases educational attainment, within the framework of Kabeer’s (2018) theory of change for women empowerment, in which the livelihood intervention of free education can give women access to resources while being limited by gendered ‘structures of constraint’. I test the nationwide impact on the likelihood of secondary school attendance, completion and years of education for all women. I further estimate the impact on women from low-income families relative to wealthy households to examine the extent to which FSE was successful at improving the education of the most cost-constrained girls. Finally, I compare the impact between less relative to more developed provinces of Kenya to investigate potential region-specific ‘structures of constraints’ to women’s schooling and the extent to which the policy helped regions with the lowest initial educational attainment.
The study employs a difference-in-differences (DID) strategy using pooled cross-sectional data from five rounds of the Kenyan Demographic and Health Survey (KDHS) between 1993-2014, with the main analysis focused on women in 2003 and 2014 aged 20-31. I define treated women as those of secondary school age, 14-19 in 2008 (or 20-25 in 2014), and the control group as women past secondary school age, 20-25 in 2008 (or 26-31 in 2014). This way, the identification strategy exploits exogenous variation from the policy treatment, comparing the three outcomes of educational attainment for treated and control women before the policy, in 2003, to after, in 2014, controlling for demographic and socio-economic characteristics and region fixed effects (FE). Showing that the key identification assumptions hold, the DID estimator plausibly identifies the causal impact of FSE on women’s educational attainment.
Several recent studies provide evidence of the positive impact of reducing monetary costs on educational attainment in SSA (Duflo et al., 2021; 2015), with country-level studies providing evidence of the impact of free public education policies (Brudevold-Newman, 2021). This study contributes to the literature by adopting DID using the age cut-off approach to estimate the causal impact at the country level. It fills the research gap by focusing on women and estimating the effect on poor relative to rich women and in different regions. Studying FSE is highly relevant in the context of Kenya, given the importance of women’s secondary schooling to growth and socio-economic development and its extensive benefits to individuals, including better knowledge and skills, employment and income, fertility and sexual health outcomes, and independence and self-esteem (MoEST, 2015a). The findings have important implications for the design and implementation of future FSE policies in Kenya that can potentially improve the education of the poorest women in the least developed areas of the country.
This study is structured as follows. Section 2 outlines the background of Kenya and the policy context. Section 3 presents the conceptual framework and reviews the relevant empirical literature on the impact of free public education, focusing on FSE in Kenya for women. Section 4 identifies the research gap and how the research questions and methodology of this study contribute to the literature. Section 5 presents the data, Section 6 the methodology, Section 7 the results and Section 8 the robustness check. Finally, Section 9 discusses the findings and limitations, while Section 10 summarises the findings, outlining policy recommendations and areas of further research.
2. Background & Policy Context
2.1 Women’s Education in Kenya
Kenya is a lower-middle income country in East Africa, serving as a major economic, financial and transport hub in the region (WB, 2022b). Although it has achieved an average of 5% real GDP growth in the past decade, unemployment is high at 50% and the economy is dominated by agriculture and the informal sector. Despite improvements in living standards and life expectancy since 2000, poverty remains widespread with 37% living below the poverty line (WB, 2022a). Education is considered key to Kenya’s Vision 2030 to achieve sustainable socioeconomic development and improve quality of life and welfare for all citizens (VDS, 2022). Educational attainment refers to the highest grade of schooling completed, while it is often measured in developing countries as the highest grade attended or years of education (OECD, 2022). Providing quality basic education for all Kenyans has been a major priority for the government in promoting development (MoEST, 2015a). Kenya has committed to international initiatives for education, such as Education for All and the MDGs (MoEST, 2015b).
Education improved significantly in the past two decades, primarily due to free primary education (FPE) in 2003, which increased primary attendance and completion, achieving 88% net enrolment by 2014 (MoEST, 2015a). However, transition rates to secondary school were only 49% in 2005. The government launched the Gender Policy in Education in 2007 to ensure access and equality in education to enhance women’s empowerment and FPE achieved close to gender parity in primary school enrolment. However, large disparities persisted in secondary transition and completion, with the gender parity index in secondary enrolment ranging between 0.89-0.92 in 2000-2005 (Ohba, 2009).
2.2 The FSE Policy
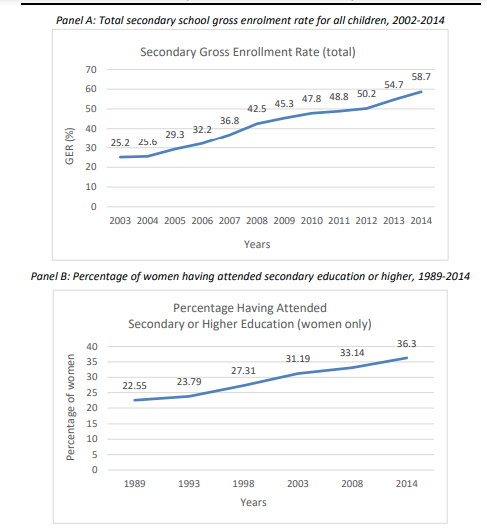
The Kenyan government introduced FSE in 2008 to increase the transition rate from primary to secondary school from 49% to 70% by 2010, identifying high costs as the primary barrier to secondary education (Ndiku & Muhavi, 2013). The government provided Ksh10,265 (US$164) annually per child for tuition, disbursed directly to public secondary schools, while parents continued to pay for lunch, uniforms, school maintenance and boarding. This significantly reduced the cost of secondary school, particularly in day schools, by 58% from Ksh11,628 to Ksh4,938 (Ohba, 2009). Transition rates to secondary increased from 45.8% to 70% between 2003-2010 (Ndiku & Muhavi, 2013). Government data reveals a rapid rise in the total gross enrolment rate from 25.2% to 58.7% between 2003-2014 (Figure 1 Panel A). The KDHS reveals similar patterns for women, with the percentage of women having attended secondary school or higher increasing from 22.55% to 36.3% between 1989-2014 (Panel B).
2.3 Problem Statement & Relevance
Despite efforts to improve secondary education, around half of secondary school-aged children are not enrolled in school (Ndiku & Muhavi, 2013). In 2003, less than 11.3% of secondary students came from the poorest and lower-middle per capita income groups, whilst 44.3% came from the upper-middle and richest quintiles (Kosgei & Keter, 2016). Corruption and inefficiencies, limited monitoring and accountability, lack of funding, and delays in disbursement led schools to accumulate large debts, with audits revealing Ksh4.6 billion missing between 2008-2011 (Ndiku & Muhavi, 2013). As FSE funds were equally allocated to children regardless of socio-economic status, parents in lower-income families struggle to meet additional expenses, forcing children to drop out. High unemployment and informality and limited skilled job opportunities lead to low incentives to pursue secondary education (ibid).
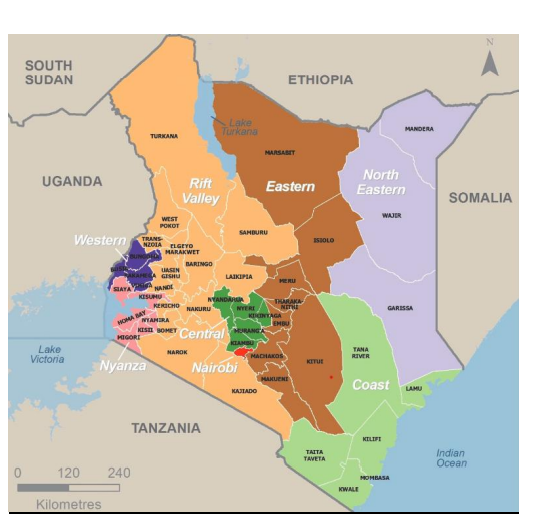
Furthermore, gender inequality in education remains a pressing issue. Between 2009- 2013, secondary enrollment for girls increased by only 9% compared to 10.7% for boys, and girls had a retention of 88% relative to 92% for boys. Drop-out rates remain particularly high amongst girls from poor households, especially those in rural areas. Cultural norms of traditional gender roles in society that dictate early marriage, childcare and household work are key drivers behind gender inequality in education, with girls often facing discrimination in schools and the household. Finally, the 8 regions and 47 counties of Kenya (Figure 2) vary widely in poverty rates, living standards and employment opportunities, as well as educational attainment, schooling infrastructure and gender disparities in education (MoEST, 2015b). Lack of secondary education and gender disparities are most prevalent in parts of Rift Valley, North-eastern and Coast regions. The latter two provinces have three times lower secondary completion rates than Nairobi and Central, and more than 70% of children, mostly girls, drop out prematurely (ibid).
Given these issues, studying a policy that can enable girls to attain secondary schooling and improve gender disparities in education is highly relevant in Kenya. At the macro level, human capital accumulation and closing the gender gap in education and labour force participation can be key to Kenya’s growth and development growth (Klasen & Lamanna, 2009). Secondly, secondary education has myriad social and economic benefits to individuals beyond those of primary schooling. It can provide knowledge and cognitive skills, enable access to tertiary education and skilled employment, and improve earning potential and upward social mobility to help adolescents escape poverty. Finally, secondary schooling can contribute to delaying pregnancy, encouraging safer sexual behaviour and reducing the prevalence of HIV. It can delay early marriage, contribute to financial independence and empower women to improve their position in society and self-worth (MoEST, 2015a).
FIGURE 1
Secondary Gross Enrollment Trends in Kenya
3. Literature Review
This section reviews the relevant literature on the impact of free secondary education on educational attainment. First, I present the conceptual framework that employs Becker’s (1962) theory of demand for schooling and situates it within Kabeer’s (2018) framework for women empowerment, applying them specifically to free secondary education for women in Kenya. Furthermore, I outline the relevant empirical literature, including studies on small-scale costreduction interventions and free public education policies in SSA, with a particular focus on the Kenyan FSE and women’s education. I discuss the advantages and limitations of their research design, which informed my own methodology and study focus.
3.1 Conceptual Framework
3.1.1 Theory of Demand for Schooling
The conceptual framework employed in this study is built on literature establishing the relationship between the cost of education and the demand for schooling. The theoretical foundations were established in Becker’s (1962) human capital model, which models how investment in human capital formation, through education and training, is associated with tradeoffs between present monetary and opportunity costs and higher future earnings. Monetary costs include expenses like tuition and school supplies, while opportunity costs are the next best alternative one must forgo to pursue their choice, such as the cost of time and foregone labour earnings. The latter arises as resources which could be used to productively add to current output or income are instead used to raise future incomes (Becker, 1962). Becker & Lewis (1973) specified this model to parents’ decisions in investing in children’s human capital through education. In this model, parents are forward-looking agents who perform a cost-benefit analysis when making choices on investment in children’s schooling, weighing present costs against future benefits of education. They maximise utility subject to cost constraints by equating the marginal cost of an additional year of schooling to its marginal returns. Costs are weighed against the benefit of a higher discounted present value of net future earnings (Becker, 1965).
Predictions of this theory inform the hypothesis that the Kenyan FSE, reducing the cost of
education, increased women’s educational attainment. The theory predicts that a reduction in
the monetary costs of additional years of schooling, given fixed perceived or actual benefits,
induces parents to invest more in children’s education. The income elasticity of the human capital
or ‘quality’ of children is high, such that an increase in parents’ income induces a large increase
in investment in education. In this model, Becker & Tomes (1976) theoretically predict that
‘public subsidies’, or any public monetary contribution to children’s schooling, increases the
effective wealth of families and induces a ‘price effect’ or ‘efficiency effect’ that leads parents to
invest more in schooling
3.1.2 Demand for Secondary Schooling in Developing Countries
The conceptual framework further incorporates other factors that scholars identified as determinants of actual or perceived costs and benefits of schooling. On the one hand, literature has shown that the marginal costs of schooling are influenced by the number of children in the household, current labour market opportunities and travel time to school (Burde & Linden, 2013). Families with more children tend to invest less in the education of each child, as the cost of increasing the ‘quality’ of children through education is greater the more children families have (Becker & Lewis, 1973). In addition, employment opportunities provide alternatives to schooling, increasing its opportunity cost, as children forego current labour market earnings for higher future earnings. The Mincer equation shows that future earnings are a function of years of schooling and labour market experience, implying a trade-off of foregone experience when investing in schooling (Mincer, 1958). On the other hand, literature identified children’s talent, quality of schooling and graduation probability as determinants to the benefits of schooling. Parents invest more in the education of children with greater perceived benefits to education due to better ‘endowments’ of genetically inherited ability (Becker & Tomes, 1976). Parents often match investments in education to perceived quality of schooling (Becker, 1974) and bettereducated parents tend to value and invest more in education (Lloyd & Blanc, 1996).
These factors may mute the positive impact of FSE on women’s education in Kenya, as they imply strong trade-offs between monetary costs and investment in secondary education in developing countries, especially for the poor. It is particularly difficult for uneducated parents to accurately perceive the quality of education and they often undervalue its benefits (Montgomery, 2000). Secondary education has large opportunity costs of foregone labour market earnings in developing countries, as high informality and abundant unskilled and agricultural employment make it easier for adolescents to join the workforce despite being uneducated. Limited availability of skilled employment, especially in rural areas, can limit the benefits of schooling, as many educated youths compete for limited public sector employment (Duflo et al., 2021). For low-income families, marginal costs are a larger proportion of their income, and they also need children to work for the family or support them financially (Montgomery, 2000). Thus, in the context of poverty, limited perceived or actual benefits and large opportunity costs of secondary schooling, parents are more sensitive to increases in monetary costs and require larger reductions to increase educational investments.
3.1.2 Theory of Change for Women Empowerment
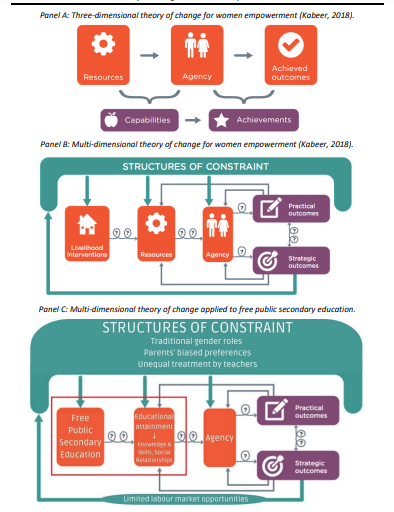
I study the predictions of the theory of demand for schooling within the framework of the theory of change for women’s economic empowerment. Kabeer (2018) defines empowerment as the “processes through which those who have been denied the ability to exercise choice, voice and influence […] gain the ability to do so”. In the three-dimensional theory of change (Figure 3 Panel A), livelihood interventions improve women’s access to resources, which translate into stronger agency and enhanced capabilities, empowering women to realise achievements (Kabeer, 2018). This model is extended in Kabeer’s (2018) multi-dimensional theory of change with ‘structures of constraint’ (Figure 3, Panel B). These are restrictions imposed by societal rules and norms that govern social relations, which limit women’s capabilities relative to men and prevent them from achieving practical or strategic outcomes. Feedback loops from society’s responses to existing constraints reinforce these barriers.
I adapt this framework to analyse FSE in Kenya as a livelihood intervention promoting women empowerment, focusing this study on the relationship between free public secondary education and educational attainment in the red frame (Figure 3, Panel C). Building women’s adolescent capabilities through education plays a key role in economic empowerment, as it greatly determines their economic capabilities later in life (Kabeer, 2018). Free education can promote women’s access to human resources like knowledge and skills and social resources like relationships. This can enhance women’s cognitive capabilities to think critically, practical capacity to realise aims, and subjective capacity to improve their self-worth and position in society. These can give them agency to realise achievements (ibid).
Furthermore, I consider that ‘structures of constraints’ that can limit the positive effect of FSE on educational attainment, as predicted by the hypothesis based on the schooling demand theory. They can pose barriers to girls’ access to education beyond boys’, and limit cost-reduction interventions in enhancing resources and capabilities (Kabeer, 2018). First, they include ‘intrinsically gendered’ family and community institutions, such as traditional norms of unequal gender roles promoting early marriage and pregnancy, housework and childcare for women (Kabeer, 2018). Parents often have gender-based preferences due to a perception of greater benefits to educating boys than girls (Gertler & Glewwe, 1992). Second, they can be present in formal ‘gender bearing’ societal institutions through formal rules and procedures or informal attitudes and behaviours (Kabeer, 2018), for instance, in teachers’ unequal treatment of girls in schools (Psaki et al., 2022). Feedback loops reinforce existing constraints, for example, when parents invest less in girls’ education due to limited labour market opportunities available to women. Constraints vary between different regions or social groups and intensify class-related inequalities, such as poverty (Kabeer, 2018).
FIGURE 3
Theory of Change for Women Empowerment
3.2 Empirical Literature
3.2.1 Free Public Education
Several recent empirical literature in developing countries provide evidence, in line with predictions of the theory, that reducing monetary costs increases educational attainment. Studies examining small-scale interventions often uses randomised control trials (RCT) or regression discontinuity designs (RDD) to exploit exogenous variation and identify the causal effect of relaxing cost constraints. For example, Duflo et al. (2021) conduct an RCT of randomly assigned secondary school scholarships in Ghana and find that free education increases the likelihood of completing secondary school by 60% and years of education by 1.25 years for the treatment relative to the control group. Similarly, Filmer & Schady (2014) study the impact of providing secondary school scholarships for three years in Cambodia, using a sharp RDD which exploitsthat eligibility for scholarships was determined by children’s predicted dropout risk. They find that free secondary schooling increased education by 0.6 years.
However, small-scale RCTs are less feasible to study the impact of national education policies. Instead, many large-scale studies use quasi-experimental designs to solve the endogeneity problem of schooling choice and identify the country-level causal impact of free public education in SSA. Kan & Klasen (2020)study the 1997 FPE in Uganda, comparing the impact of being in age cohorts impacted by the policy relative to those before. They run a linear ordinary least squares (OLS) regression using panel data between 2005-2014, with age dummies for children born between 1980-1997. They find no effect on years of education and likelihood of primary school completion from being in treated age cohorts relative to the control. However, although they control for household FE and individual characteristics affecting access to education, the OLS estimators can be biased if other observable or unobservable factors outside the regression are correlated with age and impact educational attainment (Ozier, 2018).
Thus, most literature instead uses DID to exploit exogenous variation in policy treatment, combining temporal variation using the age treatment approach with plausibly exogenous geographic variation. Lucas & Mbiti (2012) investigate the 2003 FPE in Kenya, running a DID that exploits variation in district intensity and years of exposure to the program based on age to isolate the causal impact. They calculate district-year intensity using district-level pre-program grade 8 dropout rates before FPE, under the premise that FPE had a larger impact in areas with high pre-program dropout rates and on age groups who were exposed for longer. They find that FPE increased completion rates in public schools by 10% over pre-policy levels, without reducing test scores. Combining these sources of variation effectively overcomes the difficulty of isolating quasi-random treatment and control groups when free public schooling policies impact children nationwide at once rather than in phases.
3.2.2 ‘Structures of Constraint’ to Women’s Education
However, studies fail to investigate the impact specifically on girls, despite empirical evidence of ‘structures of constraints’ limiting free schooling interventions from translating into educational attainment for women. For instance, Iddrisu et al. (2018) in Ghana find significant bias favouring boys in senior-secondary school enrolment decisions by parents due to traditional attitudes towards gender roles in rural areas. Oruko et al. (2015), conducting focus groups with 79 secondary-school girls in rural Kenya, find that inadequate menstrual care, responsibility for household chores, and teachers’ unequal treatment of girls were primary reasons for dropout. However, besides studies like Osili & Long (2008) who find a positive impact of FPE for girls in Nigeria, most studies fail to consider that women face greater barriers to schooling than men.
3.2.3 The Kenyan FSE
Furthermore, studies on free schooling policies mainly focused on FPE rather than FSE, despite the importance of secondary education. There is particularly limited literature on the impact of the 2008 FSE policy in Kenya on women, despite its pressing importance outlined in Section 2. Brudevold-Newman (2021) analyses the effect of FSE on women’s educational attainment in Kenya. Using 2014 KDHS data on women born between 1983-1996, he runs a DID exploiting regional and age cohort variation in exposure to the policy that allows him to alleviate the endogeneity problem. High-intensity regions are defined as those with low pre-program transition rates. Girls aged 12-15 who finished primary school in 2007 are defined as treated and ages 16-19 in 2007 who finished after FSE as control. He finds evidence in line with the predictions of the schooling demand theory that FSE increased women’s education by 0.75 years and completion rates by 6-10 percentage points.
However, he fails to analyse the impact specifically on poor women who face the greatest cost barriers to education. Besides a few studies like Muyanga et al. (2010) who found that FPE in Kenya benefitted rich children more relative to the poor, most studies do not investigate the impact based on household wealth. Furthermore, there is limited large-scale evidence of the differences in the causal effect of FSE between regions of Kenya. Some studies using small-sample questionnaires have shown differences in the impact of the policy in different counties. For instance, Makokha (2016) and Muganda et al. (2016) used stratified random sampling, surveying 340 students and principals in Emuhaya and Bungoma counties with low pre-policy primary to secondary transition rates. While the former found that secondary completion rates increased by 7.85 percentage points from 2004 to after FSE in 2008 in Emuhaya, the latter found an increase of 32.2 percentage points between 2009-2013 in Bugoma. Nevertheless, these studies solely analyse summary statistics and do not establish geographical differences in the causal effect.
4. Research Questions
Overall, there is limited research on the impact of free secondary schooling policies at the country level in Kenya. Few studies examine the effect specifically on women and most fail to investigate the impact on poor women relative to the rich, or regional differences in the effect. Given these gaps in the literature, this study investigates the following research questions:
1. How did the 2008 FSE policy in Kenya impact women’s educational attainment, in
particular, the likelihood ofsecondary school attendance, the likelihood of completion
and years of education?
2. To what extent did the FSE have a differential impact on the likelihood of secondary
school attendance, the likelihood of completion and years of education for poor
compared to rich women and for women in different regions?
By addressing these questions, I examine the hypothesis based on the schooling demand theory that FSE increased educational attainment for women, especially for the most costconstrained. The impact is expected to vary depending on women’s region of residence. Within the women empowerment framework, the extent to which free schooling translated into resources and capabilities from educational attainment is expected to be influenced by ‘structures of constraint’, although this is not directly tested.
I adopt the age cohort approach of Lucas & Mbiti (2012) and Brudevold-Newman (2021) to exploit exogenous variation in the policy treatment and contribute to the literature by identifying the causal effect of the Kenyan FSE nationwide. I focus on FSE given the importance of women’s secondary education and the strong trade-offs between cost and investment in secondary schooling in developing countries. This study fills the research gap by focusing on women, testing multiple dimensions of educational attainment and estimating the differences in policy impact between poor and rich women and different regions of the country. It examines whether the policy was successful at getting the most cost-constrained women into secondary school and potentially sheds light on region-specific barriers to women’s schooling.
5. Data
5.1 Dataset
This study uses secondary data from KDHS between 1993-2014 (ICF, 1993-2014). The DHS was chosen for this study, as it is a readily available, nationally representative survey focusing on women aged 15-49 that includes a range of demographic and socioeconomic characteristics (ICF, 2022) and is widely used by empirical literature on FPE and FSE (Chicoine, 2019). The full dataset under analysis is an independently pooled cross-section that contains observations on 63,139 women from 1993, 1998, 2003, 2008 and 2014. The main analysis uses data on 39,274 women in 2003 and 2014, focusing on ages 20-31. Women of this age group in the remaining years are used for validity and robustness checks. Table 1 shows the summary statistics for these two years, while Table A1 and A2 in Appendix I-a show summary statistics for the remaining years and the definitions and descriptions of variables.
5.2 Outcome Variables
Educational attainment is measured by the likelihood of secondary education attendance, completion and years of education. The three outcome variables provide a comprehensive analysis of improvements in educational attainment as a result of FSE in binary and continuous terms. The binary variable Sec measures the likelihood that women have at least secondary schooling as their highest education level attended, including those who have already progressed to tertiary education. In the full sample, on average 31.2% of women attended at least secondary schooling or higher in 2003 and 36.3% in 2014. The binary variable Complete measures the likelihood that women have completed secondary education, including those who have already progressed to tertiary education. The mean percentage of women who have at least completed secondary school is 20.2% and 21.7% for 2003 and 2014, respectively. Years of education EduY is a discrete, continuous variable showing the number of years that women completed in school. The mean years of education are 7.1 and 7.58 years in 2003 and 2014, respectively.
In 2014, a larger proportion of women have attended and completed at least secondary school in the cohort aged 20-25, who were of secondary school age in 2008, than the older cohort aged 26-31, who were past secondary school age. In contrast, in 2003, there is little difference between the two age groups. This indicates that a policy or shock between 2003 and 2014 led the educational attainment of women of ages exposed to FSE to increase more than the education of those plausibly not exposed. These patterns motivate the empirical strategy of this study, as outlined in Appendix II.
5.3 Control Variables
Controls for women’s demographic and socio-economic characteristics and region FE are included in the regressions. Firstly, individual controls include age, ethnicity, religion, household wealth, number of household members, and urban or rural residence. These variables, directly controlling for observable characteristics, also aim to indirectly control for unobservable factors they are correlated with, which are outside the regression and can impact educational attainment and differ systematically by age cohort. Control variables are correlated with secondary school attendance, completion and years of education but uncorrelated with the policy treatment. Thus, they alleviate omitted variable bias and endogeneity in schooling choice. Secondly, region FE control for observable and unobservable time-invariant characteristics that are different between regions and can impact educational attainment, such as labour market conditions, alternatives to secondary schooling or preferences for employment relative to education. Controls were chosen as the most common confounding factors impacting educational attainment and are frequently used in literature to isolate the causal effect of FSE (Muyanga et al., 2010). Appendix I-b details why these controls were chosen and how they impact educational attainment.
TABLE 1
Summary Statistics
6. Methodology
6.1 Difference-in-Differences Identification Strategy
I estimate the impact of FSE using DID, a strategy which estimates the differential effect
of a treatment by comparing the changes in outcomes over time between a population affected
by the treatment and an unaffected population (Wooldridge, 2016). A woman’s exposure to the
policy is determined by her year of birth, or age in 2008 when the policy was enacted, a method
widely used in literature (Duflo, 2001; Chicoine, 2019). I define the treatment group as women
aged 20-25 in 2014, as they were secondary school aged 14-19 when FSE was introduced in 2008
(born between 1989-1994). The control group consists of women aged 26-31 in 2014, who were
past secondary school, ages 20-25 years in 2008 (born between 1983-1988). This age group was
plausibly not affected by FSE, as they would have had to return to secondary school to take
advantage of the policy.
Kenya’s education system consists of eight years of primary education through ages 6-13, four years of secondary schooling through ages 14-18 and four years of higher education. I extend the secondary school age range for treated women to allow for grade repetition and late entry. Although studies show that exposure to the policy increases with age for cohorts younger than secondary-school age (Duflo, 2001), I exclude younger girls below age 20 in 2014 (or age 14 in 2008) from the treatment group, as they may not have finished making choices on secondary schooling by that age. I define the control age range to mimic the 5-year interval of the treated group. I use 2003 and 2014 as my pre-treatment and post-treatment years, respectively. Data from 2008 is not chosen as pre- or post-policy, as there would be an overlap between age treatment and control groups since the data is not a panel but pooled cross-sectional. There could also be partial treatment in 2008 if some women have already been impacted by FSE at the time of the surveys, reporting having attended secondary school when others have not yet benefitted.
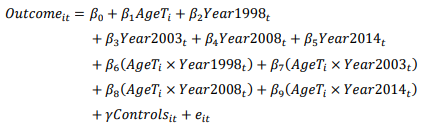
6.2 Estimating Equation
I estimate the multivariate regression (1) by OLS estimation, where 𝑖 = 1, 2, … , 𝑛,𝑡 = 0,1 and 𝛾 is a vector of control variables. I regress the dependent variables of educational attainment – the likelihood of women having attended secondary school or higher 𝑆𝑒𝑐𝑖𝑡, the likelihood of women having completed at least secondary school 𝐶𝑜𝑚𝑝𝑙𝑒𝑡𝑒𝑖𝑡 and years of education 𝐸𝑑𝑢𝑌𝑖𝑡 – against the age treatment 𝐴𝑔𝑒𝑇𝑖 , year dummy 𝑌𝑒𝑎𝑟2014𝑡 for 2014, the interaction between age treatment and the year dummy 𝐴𝑔𝑒𝑇𝑖 × 𝑌𝑒𝑎𝑟2014𝑡 , and control variables. 𝐴𝑔𝑒𝑇𝑖 equals 1 for women aged 20-25 in 2014 and equals 0 for those aged 26-31 in 2014. 𝑌𝑒𝑎𝑟2014𝑡 equals 1 for observations in 2014 and 0 for those in 2003. The DID interaction 𝐴𝑔𝑒𝑇𝑖 × 𝑌𝑒𝑎𝑟2014𝑡 compares the difference in the three educational outcomes of the age treatment to control groups, between before and after FSE.
![]()
The coefficient estimate 𝛽0 ̂ shows the average years of schooling or proportion of women who attended at least secondary education in the control group in 2003. 𝛽1 ̂ shows the difference between outcomes of educational attainment of the control and treatment groups in 2003, or the change in educational outcomes from being in the treated group holding all else constant. 𝛽2 ̂ controls for systematic differences in educational attainment in the control and treatment groups between 2003 and 2014. In other words, it shows the change in educational outcomes from being in 2014 compared to 2003, holding all else constant. 𝛽̂3 shows the average treatment effect of FSE, or the difference in educational attainment between women of secondary school age and post-secondary ages in 2008, once the initial pre-treatment difference in the education of the two groups has been accounted for, as outlined in Appendix III. This coefficient is expected to be positive. With the binary variables 𝑆𝑒𝑐𝑖𝑡 and 𝐶𝑜𝑚𝑝𝑙𝑒𝑡𝑒𝑖𝑡, the regression is a linear probability model in which the coefficients indicate the impact on the predicted probability of attendance and completion (Wooldridge, 2016).
I first run regression (1) using the full sample to estimate the overall impact of FSE. Then I estimate how the effect was different depending on household wealth. I estimate regression (1) for subsamples of the Poorest, Poorer, Richer, and Richest women based on the KDHS Wealth Index which categorises households into quintiles based on a comprehensive score of living standards using assets and consumer items, housing construction materials, and access to water and sanitation (ICF, 2022). Subsampling allows me to examine a major policy aim by testing whether FSE improved education more for poor women relative to rich, as the former face greater cost barriers to secondary schooling. Finally, I examine regional differences in policy impact by running the regression for subsamples of women in the eight regions of Kenya, potentially shedding light on region-specific barriers to women’s secondary education.
6.3 Key Identification Assumptions
The DID coefficient can be interpreted as the causal impact of the policy under the following assumptions. In this study, most of these assumptions are demonstrated to plausibly hold, alleviating potential threats to the validity of the identification strategy.
6.3.1 Parallel Pre-trends in Educational Outcomes
The key identification assumption for DID is that absent the treatment, outcome variables for the treatment and control groups would have evolved at a similar rate over time, such that any change to outcomes for the treated relative to the control results from the treatment. Educational outcomes for women exhibit parallel pre-trends, with the proportion having attended and completed at least secondary school and years of schooling increasing at a similar rate for treated and control groups between 1993-2008 (Figure 4). The difference would have remained constant without FSE, given the absence of policies with a similar treatment rule and constant differences in observable characteristics between age cohorts, as outlined in Sections 6.3.3 and 6.3.4.
After the policy, the education of the treatment group increased at a higher rate than the control, leading treated women to have a greater proportion attending in 2014. In contrast, the education of the control group as a counterfactual remained at the same rate of increase without a substantial rise in slope. Given that other assumptions hold, any change to the difference between the groups from a differential change to the education of treated women can be attributed to FSE. One must note that the pre-parallel trends hold weaker for completion and years of education than attendance and there is an increase in attendance for treated women already in 2008, potentially due to partial treatment.
6.3.2. No Selection Bias and Quasi-random Treatment Assignment
The policy treatment must be exogenous and quasi-random, without women selfselecting into being impacted by FSE. Selection bias could occur if women with certain observable or unobservable characteristics that make them more or less prone to joining secondary school are more likely to receive the fee elimination. For instance, women with more educated parents, pro-education preferences or better abilities may be more inclined to attend and self-select into being treated. These could positively and negatively bias the estimate of the impact of FSE, respectively. In this study, given that year of birth is quasi-random and cannot be influenced by women, the assignment to treatment and control groups is exogenous, alleviating selection bias. The time dummy indicating the post-policy period is also exogenous for these reasons. The age treatment and time variation introduce exogenous variation that allows the identification of the causal effect.
6.3.3. No Alternative Policy or Shock
There should be no policy change or shock other than FSE between 2003-2014 that differently affected the secondary education of treated and control women, as the estimator could capture their effect. In Kenya, the estimator could capture the impact of the 2003 FPE alongside FSE. The policy increased primary education attainment for children aged 6-13 in 2003, who were thus more likely to attend and complete secondary school when becoming ages 11-18 in 2008 (Muyanga et al., 2010). However, within this cohort, FPE is expected to have the largest impact on girls starting primary school aged 6-7 in 2003, with the impact increasing with age for younger children (Duflo, 2001). These girls are outside of the chosen treatment age group in 2008. Also, despite high primary completion rates, Kenya continued to suffer low enrollment in secondary school (MoEST, 2015a). Thus, FPE is likely responsible for a small portion of gains in secondary education. There was plausibly no other nationwide policy between 2003-2014 that impacted secondary education on a large scale using the FSE’s treatment rule. Thus, any differential change to the treated compared to the control can plausibly be attributed to FSE.
6.3.4. Comparable Treatment and Control Groups
The control group is a good counterfactual for the treated, such that the impact on the educational outcomes for the control group show what would have happened to treated women without FSE. In this study, the treatment and control age groups differ in baseline characteristics pre-treatment that could impact schooling choice in response to the policy. However, as the difference in means in these characteristics did not change significantly over the pre-treatment period between 1993-2008, any change in educational attainment post-treatment cannot be attributed to these factors. These variables are also added as controls to the regression to account for systematic differences between age cohorts.
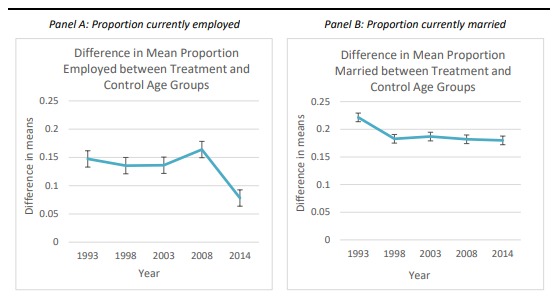
For instance, women’s employment and marital status are factors in which changes could influence the schooling choice of treated compared to control women upon the introduction of FSE. While the difference between treated and control groups remains positive, the overlapping confidence intervals indicate that the magnitude of the difference did not change significantly between 1993-2008 and 1998-2014, respectively (Figure 5). Table A4 in Appendix IV shows similar patterns for other observable, potentially confounding baseline characteristics. Note that although the difference in employment reduces in 2014, employment is not included as a control due to reverse causality. Nevertheless, this change is unlikely to greatly negatively bias the estimates, as the groups become more similar as the difference reduces to close to zero.
FIGURE 4
Parallel Pre-trends in Educational Outcomes
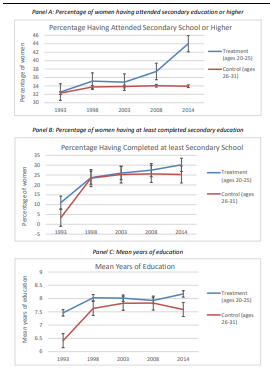
1993-2014. Panel A: trends in the proportion of women who have attended at least secondary school. Panel B: proportion who has completed at least secondary. Panel C: mean years of schooling.
FIGURE 5
Balance Test: Difference in Means in Baseline Characteristics
7. Results
7.1 Full Sample Results
Results of the DID estimation reveal that FSE had a strongly statistically significant positive effect on the likelihood that women have attended secondary school or higher as their highest education level (Table 2 Panel A). Women in the treated group, aged 14-19 in 2008, are 11.3 percentage points more likely to have attended at least secondary school by 2014 compared to the cohort five years after secondary school age, 20-25 in 2008. In other words, out of 100 women in the secondary age cohort at the time of FSE, at least 11 were induced to attend high school or higher by 2014 as a result of the policy. Furthermore, FSE has a strongly statistically significant positive impact on the likelihood that women completed at least secondary school or higher and years of education (Panels B and C). Treated women were 5.04 percentage points more likely to at least complete secondary school or progress to higher education and had on average 0.629 years more education in 2014 than those five years older in 2008.
The estimates are robust to including controls and region FE. The coefficients increase when adding controls, indicating a negative, downward bias without controls that would have underestimated the impact. Given that the key identification assumptions hold, the coefficients plausibly show the causal impact of FSE on secondary school attendance, completion and years of education.
Results provide evidence consistent with the literature on the positive impact of reducing the costs of education on demand for schooling and educational attainment, particularly with studies finding a positive effect of FSE in Kenya. The magnitude of years of education is similar to Brudewold-Newman (2021) who finds an increase of 0.75 years for women from the FSE. However, he finds coefficients of 0.15-0.25 on secondary school completion, three to five times larger than the estimates in this study. This could be because he examines different treated age groups that only include girls who completed primary school and are more prone to enroll in secondary and uses geographic variation in initial schooling levels to isolate the effect. The positive impact also corresponds with estimates elsewhere in SSA, however, magnitudes vary across countries, time periods and identification strategies (Duflo et al., 2021).
7.2 Wealth Differences in Impact
Results from sub-sampling based on wealth quintiles reveal that FSE had no significant impact on the likelihood that the poorest women have attended at least secondary school as their highest education level (Table 3 Panel A). Although there is some significant impact for poorer women, the coefficient is smaller than for richer and the richest women, both of which experienced a positive significant effect on attendance. Amongst richer and the richest women, the treated age cohorts were 16.1 and 19 percentage points more likely, respectively, to have attended at least secondary education by 2014 compared to the control cohorts. In contrast, the poorer and poorest women were only 13.5 and 4.1 percentage points more likely to attend. Similarly, there is no significant impact on completion and years of schooling for the poorest or poorer women, whilst there is a significant, positive impact for the top two quintiles (Panels B and C). The richer and richest treated women were 11 and 12.8 percentage points more likely to complete and had 1.12 and 1.01 years of education in 2014 relative to control women.
Finding limited improvements to poor women contrasts with literature that finds a positive impact from giving secondary school scholarships to poor children (Filmer & Schady, 2014; Duflo et al., 2021). This may be because these RCTs targeted the poor rather than generally offering all parents the option of free schooling. While these FSE studies do not compare rich and poor children, similar wealth differences in increases in enrolment to this study were found for FPE in Kenya (Muyanga et al., 2010).
7.3 Regional Differences in Impact
Results from sub-sampling based on regions reveal that FSE had a significant positive impact on women’s secondary school attendance in all regions except in Coast and Rift Valley, with significant regional differences in the magnitude of the impact (Table 4 Panel A). In regions with the largest impact, like Nyanza and Nairobi, FSE increased the proportion of women having attended at least secondary school by 22.6 and 15.9 percentage points, whilst in North-eastern the impact was only 9.2 percentage points. FSE only had a significant positive impact on completion of 12.8 and 10.4 percentage points in Nyanza and Western regions and had a positive significant impact on years of education in only half the regions, with significant regional differences in magnitude (Panels B and C). Women in Central, the region with the largest impact, experienced a 1.192-year increase, while education rose by only 0.741 years in Western. Nevertheless, estimates may be insignificant due to small sub-sample sizes.
Finding geographical variation in impact corresponds with Makokha (2016) and Muganda et al. (2016) who find different magnitudes of increase in completion in different counties of Kenya, with both finding a positive impact on completion in counties in the Western province. Nevertheless, magnitudes differ from this study, as the authors use summary statistics for all children that cannot be compared to regression estimates for girls only.
TABLE 2
Difference-in-Differences Estimates of the Impact of the Free Secondary Education
on Secondary School Attendance, Completion and Years of Education
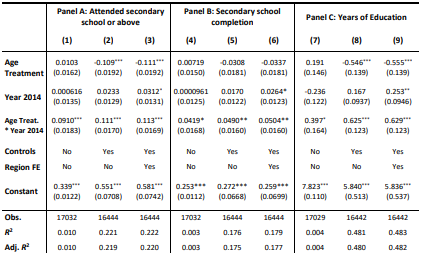
Table 2 – Difference-in-Differences Estimates of the Impact of Free Secondary Education on Secondary School
Attendance, Completion and Years of Education. Columns (1) to (3) contain estimates using the outcome variable of
women having attended at least secondary school or higher. Columns (4) to (6) contain estimates on women having
completed at least secondary school or further progressed to tertiary. Columns (7) to (9) contain estimates on
women’s years of education. Column (1), (4) and (7) contain simple DID models without individual controls or
region fixed effects. Controls are added in Columns (2), (5) and (8). Columns (3), (6) and (9) include both controls
and region fixed effects. Table A5 in Appendix V shows the full regression output. Standard errors in parentheses.
Data: KDHS 2003-2014. *p < 0.05 **p < 0.01 ***p < 0.001
TABLE 3
Wealth Difference-in-Differences Estimates of the Impact of Free Secondary Education Policy on
Secondary School Attendance, Completion and Years of Education
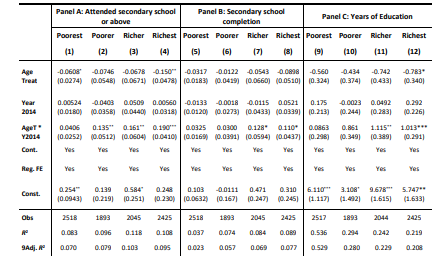
Table 3 – Wealth Difference-in-Differences Estimates of the Impact of Free Secondary Education Policy on
Secondary School Attendance and Years of Education, broken down into four wealth quintiles of poorest, poorer,
richer and richest women. Columns (1) to (4) contain estimates on women having at least attended secondary
school or higher. Columns (5) to (8) contain estimates on women having completed at least secondary school or
further progressed to tertiary. Columns (9) to (12) show estimates on women’s years of education. All regressions
include individual controls and region fixed effects. Tables A6-A9 in Appendix V show the full regression outputs,
including coefficients for control variables. Standard errors are in parentheses. Data Source: KDHS 2003-2014.
* p < 0.05, ** p < 0.01, *** p < 0.001
TABLE 4
Regional Difference-in-Differences Estimates of the Impact of Free Secondary Education Policy
on Secondary School Attendance, Completion and Years of Education

Table 4 – Regional Difference-in-Differences Estimates of the Impact of Free Secondary Education on Secondary
School Attendance, Completion and Years of Education for the eight regions of Kenya. Panel A contains estimates
using the outcome variable of women having at least attended secondary school or higher as their highest
education level. Panel B contain estimates for women having at least completed secondary school. Panel C shows
estimates for women’s years of education. All regressions include individual controls and region fixed effects. Tables
A9-A12 in Appendix V show the full regression outputs. Standard errors are in parentheses. Data Source: KDHS
2003-2014. * p < 0.05, ** p < 0.01, *** p < 0.001
8. Robustness Check
run a placebo estimation, adopted from Brudevold-Newman (2021), to test whether the coefficients estimated in the main regression are statistical artefacts. This examines whether the impact can be attributed to FSE specific to the treatment period, rather than other factors also present in other periods. I compare the impact of being treated in 2014 to the impact in placebo years 1998, 2003, and 2008, with 1993 as the base year. I estimate equation (2) using OLS,
where 𝑖 = 1, 2, … , 𝑛,𝑡 = 0,1 and 𝛾 is a vector of control variables. Similarly to the main estimation, I regress the outcome variables 𝑆𝑒𝑐𝑖𝑡, 𝐶𝑜𝑚𝑝𝑙𝑒𝑡𝑒𝑖𝑡 and 𝐸𝑑𝑢𝑌𝑖𝑡 against the age treatment 𝐴𝑔𝑒𝑇𝑖 , year dummies for 1998, 2003, 2008 and 2014, the interaction between age treatment and year dummies for each year, and control variables. 𝐴𝑔𝑒𝑇𝑖 equals 1 for women aged 20-25 and 0 for those aged 26-31 each year. The year dummies equal 1 for observations in each year and 0 otherwise. The interaction terms compare the difference between the proportion of women who have attended and completed at least secondary education and years of schooling of treatment and control groups in each year to 1993.
Results for secondary education attendance pass the placebo test, as interactions for all years except 2014 are insignificant. This indicatesthat there is no significant effect on attendance from being in the treated group relative to the control compared to 1993 in years other than post-treatment after the FSE (Table 5 Panel A). Before 2008, the coefficients are not significantly different from zero, whilst in 2014 the effect is positive, with zero outside the confidence interval (Figure 6 Panel A). Women of ages impacted by FSE are 11.4 percentage points more likely to have attended at least secondary school by 2014 relative to 1993, compared to women past secondary school age in 2008. Note that the interaction coefficient for 2008 shows some effect of lower significance and magnitude, plausibly due to partial treatment.
However, results for completion and years of education fail to pass the placebo test, as interactions are all significant and negative (Table 5 and Figure 6, Panels B and C). This indicates that the difference between years of education and completion of the treated and control groups narrowed since 1993 – younger women’s education increased slower than older women, for instance, due to older women gaining more opportunities later in life to go back to school. The parallel trends assumption may only weakly hold and control women may be a weak counterfactual for the treated. The significant difference between groups may not be specific to comparing 2003 and 2014 when FSE took effect, as differences are also significant between years without the policy. Thus, the significant positive impact on completion and years of schooling may be a statistical artefact not solely due to FSE.
TABLE 5
Placebo Difference-in-differences Estimates
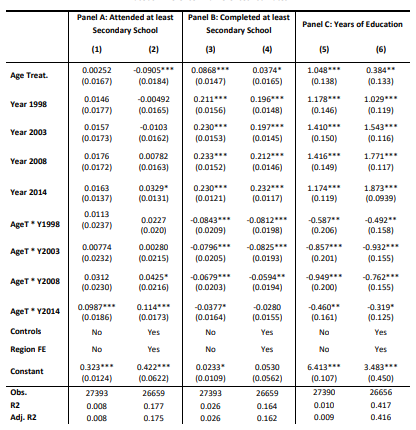
Table 5 – Placebo Difference-in-Differences Estimates of the Impact of Free Secondary Education Policy on
Secondary School Attendance and Years of Education. Panel A shows estimates for women having attended at least
secondary school or higher. Panel B shows estimates for women having completed at least secondary school, and
Panel C contains estimates on years of education. Table A13 in Appendix VI shows the full regression outputs.
Standard errors in parentheses. Data Source: KDHS 1993-2014. * p < 0.05, ** p < 0.01, *** p < 0.001
FIGURE 6
Placebo Difference-in-differences Coefficients

Figure 6 – Graph of interaction coefficients of Placebo Difference-in-Differences Estimates of the Impact of Free
Secondary Education Policy over time. Panel A shows secondary school attendance, Panel B shows secondary school
completion, Panel C shows years of education.
9. Discussion
9.1 Mechanisms Explaining the Results
The significant positive average treatment effect of FSE on secondary school attendance, which passes the placebo test, confirms the hypothesis based on the theory of demand for schooling that reducing monetary costs through ‘public subsidies’ of free education induces an ‘efficiency effect’ to increase parental investment in children’s schooling and increase educational attainment. Within the framework of Kabeer’s (2018) theory of change for women empowerment, results indicate that the livelihood intervention led to some increase in education as ‘structures of constraint’ did not fully prevent girls from benefiting from free schooling, although constraints may have restrained potential improvements, which is not tested in this study. However, estimates for completion are less than half of the overall increase in attendance, indicating that FSE mostly induced women to begin attending secondary school but failed to prevent drop-out.
While there was an increase in years of education, these estimates, along with results for completion, fail to pass the placebo test and thus may not be entirely attributable to FSE. In the schooling demand theory, it is ambiguous to what extent monetary cost reductions improved long-term educational attainment rather than just short-term attendance. Thus, within the women empowerment framework, it remains questionable to what extent increased attendance translated into significant human and social resources through which women can gain practical, cognitive, practical and subjective capabilities and agency. It depends on the extent to which incomplete secondary education can yield gains in knowledge, skills, self-worth and relationships, and its returns relative to complete secondary schooling in labour markets (Kabeer, 2018).
Three mechanisms are considered to explain the findings: monetary cost constraints, barriers beyond monetary costs, and gender-specific ‘structures of constraint’. Firstly, results based on household wealth suggest that cost reductions might have been inadequate to fully alleviate cost constraints and allow women to complete school. Contrasting the hypothesis, FSE was less successful at improving attendance for poorer compared to rich women and had limited success improving completion and years of schooling for the poorest, leading mostly rich women to benefit from long-term educational attainment. Poor women continued to face large non-fee costs despite free schooling, including lunches, uniforms and transportation (Ngware et al., 2007). Statistics show that even before FSE, low-income families benefitted less from government provision and financing of secondary school relative to wealthy households (ibid). Additional schooling expenses, like lunches, increased further after the fee elimination and remained beyond the budget of poorer households (Ohba, 2009).
Secondly, the estimated regional differences in policy impact, in line with the hypothesis, suggest that there may be other barriers in certain provinces which hurdled women in attending and completing secondary school despite free education. While FSE increased attendance in most regions, it had no significant impact on completion and years of schooling in most provinces. This is potentially due to other determinants to investment in education beyond costs that generate particularly strong trade-offs for secondary education, especially for poor girls. These include poor schooling infrastructure, low parental education, limited access to schools, long travel times, limited skilled employment opportunities and easy access to low-skilled jobs due to agriculture and high informality (WB, 2022b). In Kenya, studies have documented a limited increase in school capacity and infrastructure following FSE, as schools lacked adequate teachers and resources to accommodate increased enrolment, compromising the quality of teaching and parents’ perceptions of it (MoEST, 2015a).
Notably, regions that experienced the smallest increase in attendance had the lowest initial education levels and the highest proportion of poor women in 2003, whilst provinces with the largest gains had high initial education levels and low poverty. Figure 7, which ranks regions from largest to smallest FSE impact, shows a positive correlation between the regional FSE impact on attendance and the initial regional proportion with at least secondary attendance in 2003, and a negative correlation between the coefficient and the proportion of poorer and poorest women in 2003. Although relationships cannot be established for completion and years of education as most coefficients are insignificant, estimates in this study are consistent with statistics showing that poorer regions with low educational attainment experienced limited improvements in education relative to more educated, wealthier areas (MoEST, 2015a). Notably, these patterns are at odds with the proposition frequently employed in the literature that policies yield the largest improvements in regions where more students could be induced to attend and complete school (Osili & Long, 2008; Brudewold-Newman, 2021). Nevertheless, this may be because this study analyses aggregate regional values compared to previous county- or districtlevel analyses in previous studies, hiding within-region variationsthat may be consistent with the proposition.
Finally, there could be gender-specific ‘structures of constraint’ that limit improvements to girls’ attendance or completion despite FSE. ‘Intrinsically gendered’ family and community institutions are highly prevalent in Kenya, as women tend to have an inferior position in society relative to men, they are traditionally responsible for housework and child-care, and parents often have biased preferences favouring boys’ education (MoEST, 2015b). Gender-bearing societal institutions often discriminate against women, leading to low formal labour force participation and producing feedback loops through which parents are further discouraged from investing in girls’ schooling (Putzi, 2009). In the women empowerment framework, these constraints may have prevented the livelihood intervention of FSE from translating into greater gains in education, long-term improvements in resources and capabilities, and stronger agency to realise achievements. Nevertheless, the extent to which gendered constraints are more prevalent relative to cost constraints or other barriers to educational attainment is not established in this study.
9.2 Limitations1
9.2.1 Data and Methodology
Firstly, measuring educational attainment as women having attended or completed at least secondary school could overestimate the policy impact, as it includes those who already progressed to tertiary education. However, not including them could greatly underestimate the impact. Although panel data following the educational attainment of the same women could overcome this issue, country-level panel data like the DHS is unavailable for Kenya. Secondly, conducting quantitative rather than qualitative analysis poses inherent limitations. A quantitative study does not allow me to theoretically analyse the mechanisms behind women’s schooling choices and gender-specific constraints of different regions and socio-economic backgrounds. Supplementing with interviews and surveys would enable me to examine personal insights on FSE from girls, teachers, or government officials.
9.2.2 Internal Validity
Several factors may violate the key identification assumptions and compromise the robustness of DID. Firstly, while observable characteristics are controlled for, there may be unobservable or unmeasured excluded factors that are correlated with educational outcomes, such as parents’ education or girls’ ability, that could spuriously drive the relationship. Region FE do not control for time-variant, region-specific factors that are correlated with women’s education. For example, building additional secondary schools in certain regions but not in others between 2003-2014 could increase education and lead to overestimating the policy impact (Duflo et al., 2001). Nevertheless, these can only bias the estimates if their impact systematically differs between treated and control groups, which is unlikely given limited selection bias and no other nationwide shock impacting secondary education using the same treatment rule over the period.
9.2.3 External Validity
The findings in this study are specific to the 2008 FSE in Kenya and may not be externally valid in other developing countries. The impact that reducing the cost of schooling increases educational attainment has been widely documented in low-income countries across the world, including SSA and Kenya specifically. However, the magnitude of the estimates may vary between countries depending on several factors, including income and education levels, schooling infrastructure and gendered constraints. The estimates are difficult to directly compare to other literature in Kenya, as they employ different methodologies and examine different samples and time periods. Estimates also cannot be compared in absolute terms but should be evaluated in terms of standard deviations of change relative to the baseline level of education.
9.2.4 Scope Limitations
Finally, this study does not estimate to what extent cost barriers, as opposed to genderspecific constraints, prevent women from benefiting from free schooling. It does not examine whether women benefited from schooling long-term through tertiary education or employment and whether educational resources translated into practical and subjective agency, cognitive capabilities and achievements (Lucas & Mbiti, 2012). Long-run studies on multiple dimensions are essential to establish the comprehensive impact of FSE in Kenya (Duflo et al., 2021).
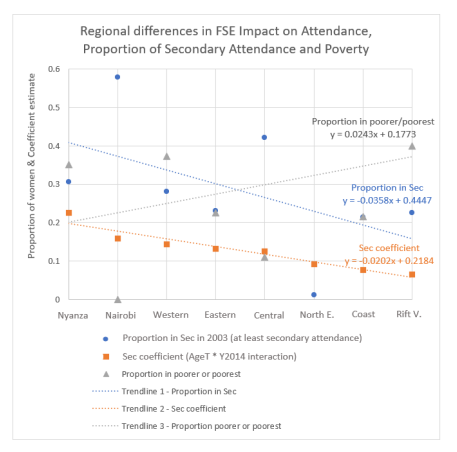
school or higher, or the DID interaction coefficient; the initial proportion of women having attended secondary
school or higher in 2003 in each region using KDHS data; and the proportion of women in poorer or poorest wealth
quintiles in 2003 using KDHS data. The trendlines show a positive correlation between the regional DID coefficient
and regional initial education level, and negative correlation with initial poverty rates. Table A14 in Appendix VII
contains the full table of values for each region. Data Source: KDHS 2003.
10. Conclusion
10.1 Conclusions
This dissertation investigates the 2008 FSE in Kenya, which eliminated tuition fees in all public secondary schools while parents continued to pay for non-fee schooling expenses. It examines how the policy impacted women’s educational attainment, more specifically, the likelihood of women having attended secondary school or higher, the likelihood of having completed secondary education or higher and years of schooling. I use KDHS data and employ a DID that exploits exogenous variation from age cohort treatment, comparing educational outcomes for treated women aged 14-19 in 2008 to control women aged 20-25 in 2008, from before FSE in 2003 to after in 2014. I show that most key identification assumptions hold, under which the DID estimator plausibly identifies the causal impact of FSE on educational outcomes.
Results indicate that FSE had a significant positive impact on women’s educational attainment. FSE increased the likelihood of attendance, robust to controls, region FE and placebo tests. It also significantly increased the likelihood of completion and years of education. The results are in line with recent studies providing evidence of the positive impact of free public education, particularly FSE in Kenya. They confirm the hypothesis based on the predictions of Becker’s (1962) theory of demand for schooling and suggest improved resources for women within Kabeer’s (2018) empowerment framework. However, the coefficient for completion is less than half of the increase in attendance and estimates for completion and years of education are not robust to placebo tests. Thus, the impact may not be fully attributable to FSE and gains in attendance may have failed to translate into long-term educational attainment. Within the empowerment framework, women might have failed to acquire long-term resources to build capabilities and agency, potentially due to gendered ‘structures of constraint’.
Furthermore, findings show that FSE was less effective at improving attendance for poorer compared to rich women, with limited improvements to completion and years of schooling for the poorest. This suggests that non-fee monetary costs remained a significant barrier to long-term gains in education for women. Finally, there are significant regional differences in policy impact, with some improvements in attendance in most regions but no significant impact on completion and years of schooling in most provinces. Notably, FSE improved education the least in regions with the lowest initial education levels and highest poverty. This indicates that other factors beyond monetary costs hurdle secondary school attendance and completion, including poor schooling infrastructure and limited skilled employment, which are more prevalent in less- than more-developed regions.
10.2 Further Research
Further research is required on the nationwide impact of FSE on a comprehensive set of educational outcomes, including long-term learning outcomes and progression into tertiary education, along with life outcomes like employment, marriage and fertility decisions, self-worth and independence. This could contribute to understanding whether women acquired resources to enhance capabilities and agency through education (Kabeer, 2018). Comparing outcomes to boys could reveal the extent to which monetary costs rather than ‘structures of constraint’ prevent women in attaining education. Evaluations should combine secondary with primary sources like interviews or surveys with girls, teachers and government officials and employ both quantitative and qualitative analysis. Using panel data and Probit or Logit would give more accurate quantitative estimates. Smaller-scale RCTs could inform specific design and implementation aspects, like how much and to whom to disburse funding.
Furthermore, studies could use county-level or geospatial data to examine the characteristics of regions benefitting most from free education, like school density, parents’ education, or alternative support available to poor families. This way, researchers could investigate the barriers limiting women’s secondary schooling depending on region and socioeconomic background. Finally, studies should compare the cost-effectiveness of alternative interventions promoting poor women’s education, including cash transfers, free school supplies and sanitary products (J-PAL 2018).
10.3 Policy Implications
The findings have important implications for designing future FSE policies in Kenya, which remains highly relevant given the persistent low secondary schooling and wide gender inequalities in education (MoEST, 2015a). Firstly, results indicate that FSE policies designed similarly to Kenya’s have the potential to significantly raise secondary school attendance for girls nationwide. However, for girls to fully realise the long-term benefits of secondary education, policies must help them complete secondary school and meaningfully lengthen their studies. To this end, the government must provide more funding to prevent dropout, especially given the strong trade-offs associated with secondary education for women in Kenya. Policies should target improving education in less developed regions with low educational attainment. For poor women, the government must cover even smaller expenses like lunches or uniforms, similarly to FPE (ibid). Given the large cost of FSE and limited fiscal budget, the government should explore alternative cost-effective financial incentives, including scholarships or conditional cash transfers (Ndiku & Muhavi, 2013)
Secondly, funding should be complemented with programs that incentivise adolescents and parents to invest in girls’ secondary education. This could involve providing information on education quality and long-term returns to schooling, providing skilled employment opportunities through civil servant positions (Duflo, 2021), or expanding vocational education that suitsthe labour market needs of underserved areas (Kabeer, 2018). Furthermore, FSE should be implemented more efficiently to ensure that schools receive adequate funding on time, with strong accountability systems to limit corruption. Investments in infrastructure and training teachers is essential for maintaining quality education, especially in underserved areas. Finally, FSE should target girls’ ‘structures of constraint’ and be complemented with interventions like financial support for ‘soft skills’ building, affordable child-care, and cash or asset transfers tied to fertility choices and sexual health (ibid). Ultimately, empowering women through secondary education can be key to promoting long-term socio-economic development in Kenya.
Bibliography
Becker, G. S. (1960) ‘An Economic Analysis of Fertility’, Demographic and Economic Change in Developed
Countries – Columbia University Press, pp. 209–240.
Becker, G. S. (1962). Investment in Human Capital: A Theoretical Analysis. Journal of Political Economy,
70(5), 9–49.
Becker, G. S. (1965). A Theory of the Allocation of Time. The Economic Journal, 75(299), 493–517.
https://about.jstor.org/terms
Becker, G. S. (1974). A Theory of Social Interactions. Journal of Political Economy, 82(6), 1063–1093.
https://doi.org/10.1086/260265
Becker, G. S. and Lewis, H. G. (1973) ‘On the Interaction between the Quantity and Quality of Children’,
Journal of Political Economy, 81(2), pp. 279–288.
Becker, G. S., & Tomes, N. (1976). Child Endowments and the Quantity and Quality of Children. Journal
of Political Economy, 84(4), 143–162. https://www.jstor.org/stable/1831106
Brudevold-Newman, A. (2021). Expanding access to secondary education: Evidence from a fee reduction
and capacity expansion policy in Kenya. Economics of Education Review, 83, 102–127.
https://doi.org/10.1016/J.ECONEDUREV.2021.102127
Burde, D., & Linden, L. L. (2013). The Effect of Village-Based Schools: Evidence from a Randomized
Controlled Trial in Afghanistan. American Economic Journal: Applied Economics, 5(3), 27–40.
https://doi.org/10.3386/W18039
Chicoine, L. (2019). “Schooling with Learning: The Effect of Free Primary Education and Mother Tongue
Instruction Reforms in Ethiopia.” Economics of Education Review 69 (April): 94–107.
https://doi.org/10.1016/J.ECONEDUREV.2019.01.002
“DHS Program – Quality Information to Plan, Monitor and Improve Population, Health, and Nutrition
Programs.” n.d. Accessed March 12, 2022. https://dhsprogram.com/.
Duflo, Esther. (2001). “Schooling and Labor Market Consequences of School Construction in Indonesia:
Evidence from an Unusual Policy Experiment” 91 (4): 795–813.
Duflo, Esther, Pascaline Dupas and Michael Kremer. (2015). “Education, HIV and Early Fertility:
Experimental Evidence from Kenya.” American Economic Review 105 (9): 2757-2797.
Duflo, Esther, Pascaline Dupas, and Michael Kremer. “The Impact of Free Secondary Education:
Experimental Evidence from Ghana.” Working Paper June 2021
Filmer, D., & Schady, N. (2014). The Medium-Term Effects of Scholarships in a Low-Income Country. The
Journal of Human Resources, 49(3), 663–694. https://about.jstor.org/terms
Garlick, R. (2019). Quality-Quantity Tradeoffs in Pricing Public Secondary Education. Economic Research
Initiatives at Duke. https://ssrn.com/abstract=3453239
Gertler, P., & Glewwe, P. (1992). The Willingness to Pay for Education for Daughters in Contrast to Sons:
Evidence from Rural Peru. World Bank Economic Review, 6(1), 171–188.
https://econpapers.repec.org/article/oupwbecrv/v_3a6_3ay_3a1992_3ai_3a1_3ap_3a171-
88.htm
ICF (1993-2014) Kenya Demographic and Health Survey [KEIR33FL.DTA, KEIR3AFL.DTA, KEIR42FL.DTA,
KEIR52FL.DTA, KEIR72FL.DTA]. Funded by USAID. Rockville, Maryland: ICF
ICF. “Demographic and Health Surveys Program”, The DHS Program website. Funded by USAID.
https://dhsprogram.com/ [Accessed: 22 March 2022].
ICF (2015) ‘Kenya Demographic and Health Survey 2014 Final Report’, Demographic and Health Surveys
Program. Kenya National Bureau of Statistics, Ministry of Health/Kenya, National AIDS Control
Council/Kenya, Kenya Medical Research Institute, National Council for Population and
Development/Kenya.
Iddrisu, A. M., Danquah, M., Quartey, P., & Ohemeng, W. (2018). Gender bias in households’ educational
expenditures: Does the stage of schooling matter? World Development Perspectives, 10–12, 15–
23. https://doi.org/10.1016/J.WDP.2018.09.001
Japan International Cooperation Agency (JICA), & International Development Center of Japan Inc. (IDCJ).
(2012). Basic Education Sector Analysis Report: Kenya.
Jejeebhoy, S.J., (1995). Women’s education, autonomy, and reproductive behaviour: experience from
developing countries., Oxford: Oxford University Press.
J-PAL Policy Bulletin. (2017). Roll Call: Getting Children into School
https://www.povertyactionlab.org/sites/default/files/publication/roll-call-getting-children-intoschool.pdf
Kabeer, N. (2018). Gender, livelihood capabilities and women’s economic empowerment: Reviewing
evidence over the life course.
Kan, Sophia, and Stephan Klasen. (2021). “Evaluating Universal Primary Education in Uganda: School Fee
Abolition and Educational Outcomes.” Review of Development Economics 25 (1): 116–47.
https://doi.org/10.1111/RODE.12725.
Kenya Ministry of Education (KME) (2018), National Education Sector Strategic Plan for the
Period 2018-2022.
Kenya National Bureau of Statistics (KNBS) (2019) 2019 Kenya Population and Housing
Census – Volume IV: Distribution of Population by Socio-Economic Characteristics.
Klasen, S., & Lamanna, F. (2009). The Impact of Gender Inequality in Education and Employment on
Economic Growth: New Evidence for a Panel of Countries. Feminist Economics, 15(3), 91–132.
https://doi.org/10.1080/13545700902893106
Kosgei K, Z., & Keter K, J. (2016). Conflict and Trade-offs Between Efficiency and Access: A Case of Day
and Boarding Secondary Schools in Kenya . 7(26). www.iiste.org
Lloyd, C. B., & Blanc, A. K. (1996). Children’s Schooling in sub-Saharan Africa: The Role of Fathers,
Mothers, and Others. Population and Development Review, 22(2), 265–298.
https://www.jstor.org/stable/2137435
Lochner, L. J., & Monge-Naranjo, A. (2012). The Nature of Credit Constraints and Human Capital.
American Economic Review, 101(6), 2487–2529. https://doi.org/10.1257/AER.101.6.2487
Lucas, Adrienne M, and Isaac M Mbiti. (2012). “Access, Sorting, and Achievement: The Short-Run Effects
of Free Primary Education in Kenya” 4 (4): 226–53. https://doi.org/10.1257/app.
Makokha, Samuel Ambrose. (2016). “Effect of Free Tuition Secondary Education Policy on Access,
Completion Rate and Quality of Education in Public Secondary Schools in Emuhaya Sub-County,
Kenya.” Education Management and Foundation.
http://edocs.maseno.ac.ke/handle/123456789/803.
Mincer, J. (1958) ‘Investment in Human Capital and Personal Income Distribution’, Journal of Political
Economy, 66(4), pp. 281–302.
Ministry of Education (MoE) Kenya. (2008). “The Development of Education National Report of Kenya.”
Ministry of Education (MoE) Kenya. (2014). Basic Education Statistical Booklet 2014.
https://www.education.go.ke/index.php/downloads/file/30-basic-education-statistical-booklet2014
Ministry of Education (MoE) Kenya. (2019). Basic Education Statistical Booklet 2019.
Ministry of Education Science and Technology (MoEST). (2015a). National Education Sector Plan 2013-
2018.
Ministry of Education Science and Technology (MoEST). (2015b). Education and Training Sector Gender
Policy. http://genderinkenya.org/wp-content/uploads/2017/12/GENDER-POLICYGUIDELINES_2015- FINAL.pdf
Montgomery, M. R., Arends-Kuenning, M., & Mete, C. (2000). The Quantity-Quality Transition in Asia.
Population and Development Review, Supplement: Population and Economic Change in East
Asia, 26, 223–256. https://about.jstor.org/terms
Muganda James, A., Mukasa Simiyu, A., & Riechi, A. (2016). The Relationship Between Subsidized Free
Day Secondary Education and Retention in Secondary Schools in Kenya. Journal of Education and
Practice, 7(17). www.iiste.org
Muhoza, D. N., Broekhuis, A. and Hooimeijer, P. (2014) ‘Variations in Desired Family Size and Excess
Fertility in East Africa’, International Journal of Population Research. doi: 10.1155/2014/486079.
Muyanga, Milu, John Olwande, Esther Mueni, and Stella Wambugu. (2010). “Free Primary Education in
Kenya: An Impact Evaluation Using Propensity Score Methods.” Child Welfare in Developing
Countries, 125–55. https://doi.org/10.1007/978-1-4419-6275-1_5.
Ndiku, J. M., & Muhavi, S. L. (2013). Government funding on access to secondary education in Kenya:
Challenges and prospects. Journal of Educational Administration and Management, 1(1), 001–
006. https://www.scholarscentral.com/pdfs/86461/government-funding-on-access-tosecondary-education- in- kenya-challenges-and-prospects.pdf
Ngware, M. W., Onsomu, E. N., & Muthaka, D. I. (2007). Financing Secondary Education in Kenya: Cost
Reduction and Financing Options. Education Policy Analysis Archives, 15(0), 24.
https://doi.org/10.14507/epaa.v15n24.2007
Ohba, A. (2009). Does free secondary education enable the poor to gain access? A study from rural
Kenya. https://assets.publishing.service.gov.uk/media/57a08b77e5274a27b2000b69/PTA21.pdf
Omariba, W. D. R. (2008) ‘Women’s Educational Attainment and Intergenerational Patterns of Fertility
Behaviour in Kenya’, Journal of Biosocial Science, 38, pp. 449–479.
doi:10.1017/S0021932005026489.
Organisation for Economic Co-operation and Development (OECD). (2016). OECD Factbook 2015-2016:
Economic, Environmental and Social Statistics. https://www.oecd
ilibrary.org/docserver/factbook-2015-72-
en.pdf?expires=1656935456&id=id&accname=ocid71015720&checksum=72822837105D6AEA3
5F1883AC05D3B42
Oruko, K., Nyothach, E., Zielinski-Gutierrez, E., Mason, L., Alexander, K., Vulule, J., Laserson, K. F., &
Phillips-Howard, P. A. (2015). “He is the one who is providing you with everything so whatever
he says is what you do”: A Qualitative Study on Factors Affecting Secondary Schoolgirls’ Dropout
in Rural Western Kenya. PLOS ONE, 10(12), e0144321.
https://doi.org/10.1371/JOURNAL.PONE.0144321
Osili, U. O., & Long, B. T. (2008). Does female schooling reduce fertility? Evidence from Nigeria. Journal
of Development Economics, 87(1), 57–75. https://doi.org/10.1016/J.JDEVECO.2007.10.003
Ozier, Owen. (2018). “The Impact of Secondary Schooling in Kenya: A Regression Discontinuity Analysis.”
Journal of Human Resources 53 (1): 157–88. https://doi.org/10.3368/JHR.53.1.0915-7407R
Psaki, S., Haberland, N., Mensch, B., Woyczynski, L., & Chuang, E. (2022). Policies and interventions to
remove gender-related barriers to girls’ school participation and learning in low- and middleincome countries: A systematic review of the evidence. Campbell Systematic Reviews, 18(1),
e1207. https://doi.org/10.1002/CL2.1207
Putzi, S. (2009) A to Z World Women in Culture and Business, World Trade Press.
Roby, J. L., Erickson, L., & Nagaishi, C. (2016). Education for children in sub-Saharan Africa: Predictors
impacting school attendance. Children and Youth Services Review, 64, 110–116.
https://doi.org/10.1016/J.CHILDYOUTH.2016.03.002
Sen, Amartya K. (1985) Commodities and Capabilities, Amsterdam (North Holland, reprinted by
Delhi, Oxford University Press).
United Nations Development Program (UNDP) (2010) Kenya National Human Development Report 2009:
Tapping the Untapped Resource.
Vision 2030 Delivery Secretariat (VDS). (n.d.). Social Pillar: Kenya Vision 2030. Retrieved July 12, 2022,
from http://vision2030.go.ke/social-pillar/#65
Wooldridge, J. M. (2016) Introductory Econometrics – A Modern Approach. 6th Edition, Cengage
Learning. doi: 10.1007/9783319659169.
World Bank (WB). (2022a) (n.d.). Kenya: Data. World Bank. Retrieved August 4, 2022, from
https://data.worldbank.org/country/KE
World Bank (WB). (2022b) (n.d.). Kenya Overview: Development news, research, data. Retrieved July 25,
2022, from https://www.worldbank.org/en/country/kenya/overview
Appendices
Appendix I: Data & Variables
Appendix I-a: Summary Statistics and Description

maximum values. Corresponding values for 2003 and 2014 are contained in Table 1.
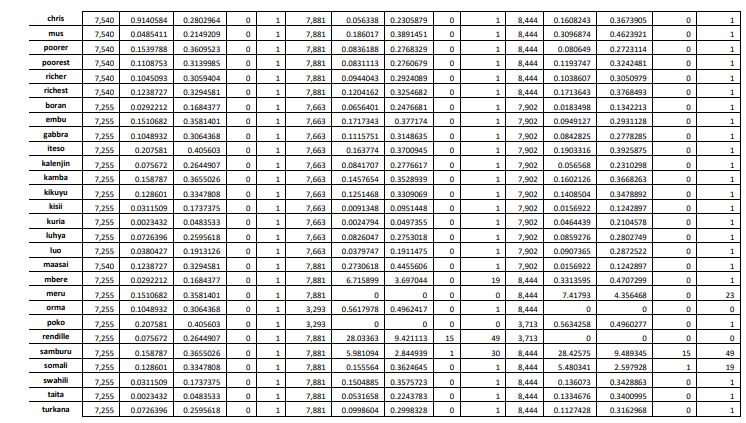
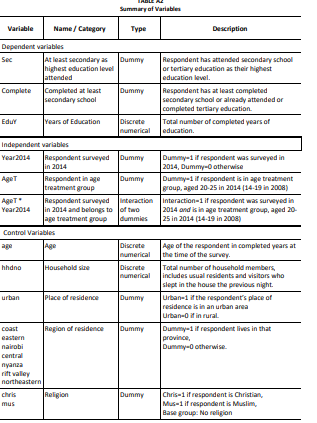
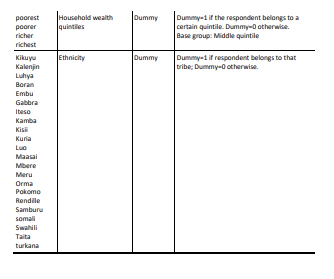
Appendix I-b: Rationale for Selecting Control Variables
This section explains in more detail the rationale for selecting these particular control variables and how they are expected to impact educational attainment, especially in the context of Kenya.
Age is included to account for the positive association that older women tend to have more years of education. Dummies for 21 of the 22 ethnicities control for differences between ethnicities in characteristics that could impact the choice of attendance, completion and years of schooling. For instance, ethnic groups can differ in parents’ education, cultural norms regarding gender roles, the marriage market and preferences for marriage relative to schooling. In Kenya, ethnic favouritism towards larger tribes like the Kikuyu relative to smaller, marginalised ones have given rise to ethnic differences in educational attainment (Omariba, 2005). Christian and Muslim account for the differences in educational attainment between women of different religions due to, for instance, differences between access to religious schools and norms concerning women’s autonomy (Muhoza et al., 2014).
Urban controls for children in urban areas being more likely to enrol and complete school than in rural areas, as they tend to live in higher-income households, closer to schools, and receive educational support (Roby et al., 2016). Hhdno controls for the fact that women in households with more members tend to receive a smaller share of income and parents’ resources, potentially having worse educational outcomes (Becker & Lewis, 1973). Poorest, Poorer, Richer, Richest control for the positive association that women from more affluent households can afford more schooling and have higher educational attainment (Roby et al., 2016). The KDHS Wealth Index categorises households into quintiles based on a comprehensive score of living using assets and consumer items, housing construction materials, and access to water and sanitation (ICF, 2022).
Finally, region FE control for observable and unobservable time-invariant characteristics that are different between regions and can impact educational attainment, for example, labour market conditions, alternatives to secondary schooling or preferences for employment relative to education. In Kenya, women in more developed regions like Nairobi or Central have better access to schools, higher household income, and more skilled employment opportunities than those in less developed regions like North-eastern (UNDP, 2010). This way, region FE control for average differences between different provinces to remove between-region variation and leave only within-region variation.
Appendix II: Patterns in Outcome Variables Underlying the Difference-in-differences Strategy
Figure A1 shows the distribution of educational attainment over ages 20-31 under analysis for 2003 and 2014, with the mean proportion for this age range shown by the horizontal dotted line. Younger women aged 20-25 in 2014 were of secondary school age in 2008 when the policy came into effect, while older cohorts aged 26-31 were past secondary school age and plausibly unaffected by FSE. In 2003, neither the younger nor the older cohorts were exposed to the policy. Panel A shows that in 2014, a smaller proportion of women have attended at least secondary school in the older cohort of ages 26-31 than in the younger cohort of ages 20-25 and relative to the mean. In contrast, in 2003 there is little difference between the education of the two age groups.
Similarly, Panel B shows that in 2003, there is little difference in the percentage of women who have at least completed secondary education between ages 20-25 and ages 26- 31, whilst in 2014, younger women have more years of schooling relative to older cohorts and the mean. Panel C reveals the same pattern in the distribution of mean years of education over age, albeit of smaller magnitude. This indicates that a policy or shock took effect between 2003 and 2014 that differentially impacted the education of women in the age group exposed to FSE, causing the educational attainment of women aged 20-25 to increase more than those aged 26-31. This pattern underlies the empirical strategy of this study.
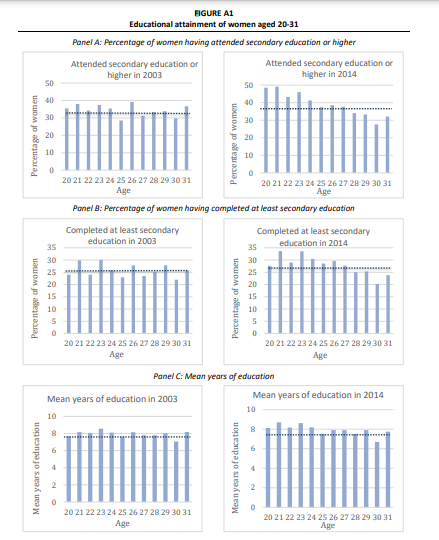
having attended secondary education or higher at each age in 2003 and 2014. Panel B shows the
percentage of women having completed at least secondary school. Panel C shows the mean years of
education. Mean values shown by the horizontal dotted line for 2003 and 2014: Panel A 34.4% and
38.9%, Panel B 25.7% and 27.7%, Panel C 7.93 years and 7.88 years. Generated by author.
Appendix III: Illustrating the Difference-in-differences Estimator.
The coefficient estimate 𝛽̂3 is the average treatment effect of FSE, showing the difference in educational attainment between women of secondary school age and postsecondary ages in 2008, once the initial pre-treatment difference in the education of the two groups has been accounted for. It can be expressed as the difference between the treatment and control group in mean years of schooling or percentage of women with at least secondary education, differenced before the policy compared to after, as shown in equation (3). Equally, it can be estimated by finding the difference between the change in mean educational attainment over time the treatment and control groups, as shown in equation (4). It shows that, as a result of solely the policy, women in 2014 who were of secondary school age in 2008 have different in 2014 than those who were past secondary school age in 2008.
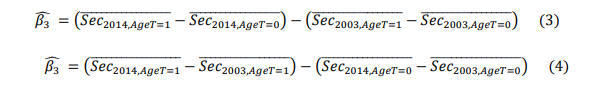
Table A3 below illustrates this logic. Panel A shows that in 2014 a higher proportion of women have attended secondary school in both the treatment and control groups compared to 2003, indicating a secular increase in educational attainment over time. However, the increase over time was larger for the treatment group, plausibly indicating the policy effect. Similarly, treated age groups had higher educational attainment in both 2003 and 2014 relative to the control, indicating that educational attainment increased over time such that younger women had more schooling than the older. Notably, the difference between the age groups was larger in 2014 than in 2003, plausibly as a result of FSE. The difference between the differences in means, as outlined above, shows a positive difference between the education of the treatment group compared to the control, after the policy compared to before. These results are in line with the patterns observed in Figure A1
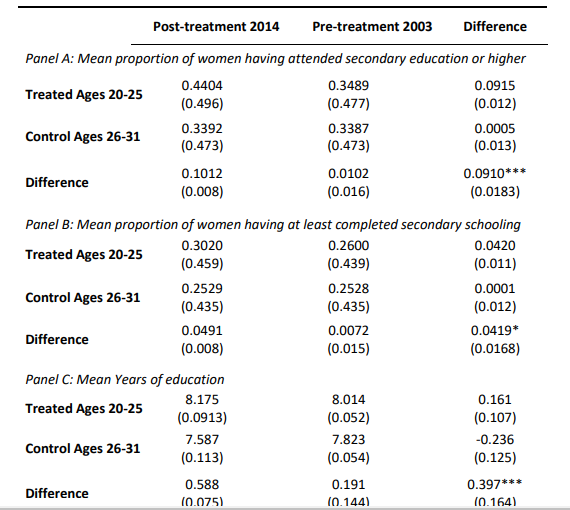
women having attended at least secondary school or higher by cohort before the policy in 2003 and
after in 2014. Panel B and C show the corresponding figures for the mean proportion of women having
at least completed secondary school and mean years of schooling, respectively. The DID estimator
indicates significant positive differences in educational attainment of treated compared to control
women after relative to before the policy. Generated by author. Standard error in parentheses
Appendix IV: Balance Tests
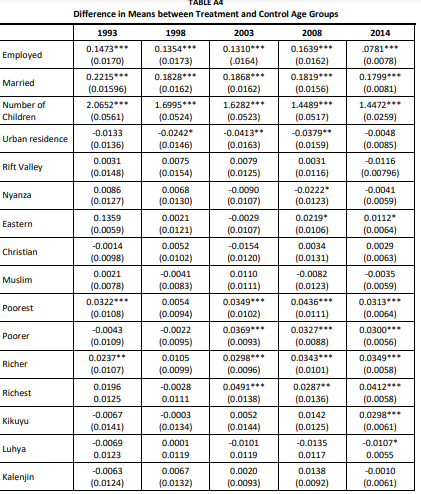
women of treatment and control age groups for each year between 1993-2014.
Appendix V: Regression Results
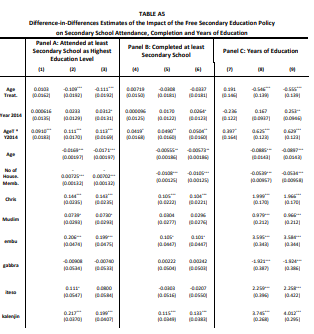


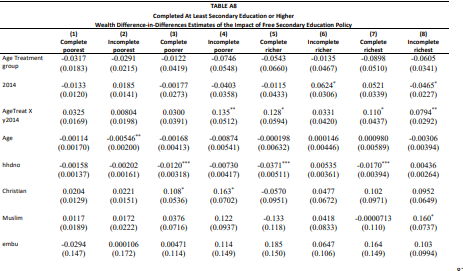
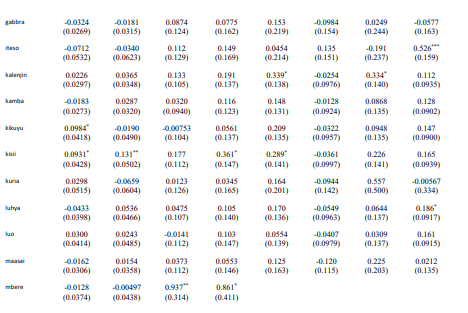
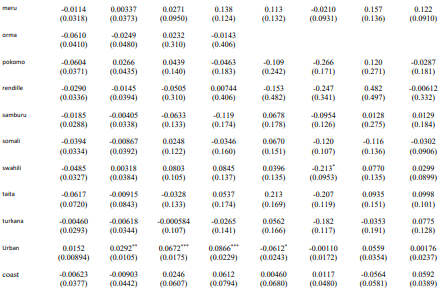

Appendix VI: Robustness Checks


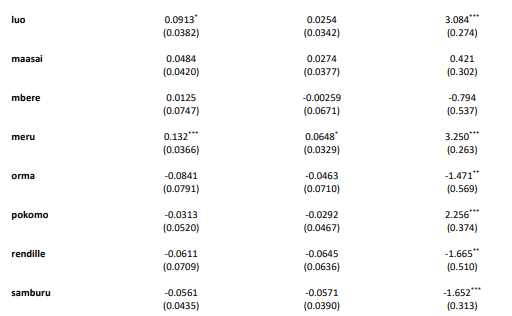
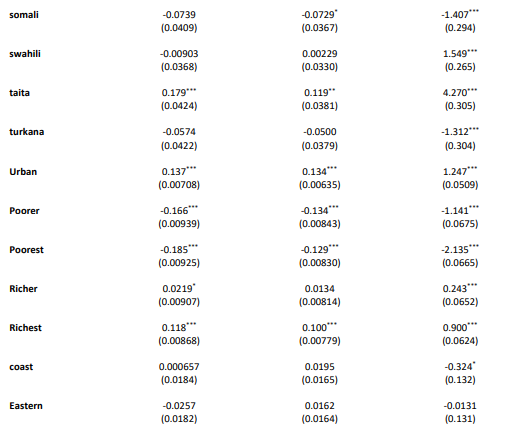

Appendix VII: Mechanisms Explaining the Results
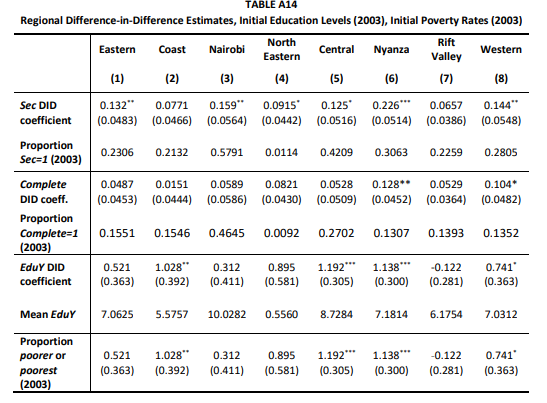
higher, having completed secondary school or higher and mean years of education, or in other words,
the DID interaction coefficients. Also contains the initial proportion of women having attended of
secondary school or higher in 2003 in each region and the proportion of women in the poorest and
poorer quintiles in 2003 in each region Appendix VIII: Further Limitations
There are several further potential limitations to this study. With regards to data and variables, the education variables lack information on whether women passed KCPE exams to enter secondary school, such that limitations in educational attainment may be falsely attributed to cost barriers or gender-specific obstacles. Combining examination data with DHS surveys could remedy this issue (Brudewold-Newman, 2021). Secondly, education variables do not measure whether education quality deteriorated due to the influx of children, which could be examined using test scores (Filmer & Schady, 2014). Finally, there is no county-level data available before FSE, as they were created according to the new administrative division of Kenya in the 2010 Constitution (KDHS 2014 Final Report, ICF, 2015). As the regional analysis can mask cross-county differences, using the DHS geospatial dataset could give more specific results.
With regards to the methodology, while DID was adopted from extensive literature analysing free schooling policies, this study could use instrumental variables or RDD. However, it is difficult to find an instrument satisfying the exclusion restriction, and an endogenous instrument can introduce large biases in the estimator. With an RDD, in the case of FSE, there are limited continuous eligibility variables appropriate for testing a clear cut-off in exposure to the policy. Furthermore, regressions with binary outcomes may be more accurately estimated using Logit and Probit models, which constrain the response probabilities of outcome variables between zero and one (Ozier, 2018). Instead, estimating the impact on the likelihood of attendance and completion using these models could show if the results are robust to these functional forms.
A further threat to identification is that using age cut-off to define treated and control groups may be inaccurate, as secondary school age may not be strictly defined in Kenya to late school entry and high repetition rates (Chicoine, 2019). Previous studies remedy this by exploiting geographical variation between high- and low-enrolment regions. Although results for regional differences indicate that this may be inappropriate for this study, using countyor district-level data or the DHS geospatial dataset could give more specific results. Finally, with regards to the scope of the investigation, I focus solely on the short-run educational outcomes of women in the first cohort immediately impacted by FSE. The study does not examine the long-term educational impact on school entrance and retention for younger cohorts (Lucas & Mbiti, 2012).